
Monday is the last day that Ketchikan’s web-based COVID-19 dashboard will be updated. But that doesn’t mean there won’t be any online information about COVID-19 in Ketchikan — it’s still out there, just in a different place. KRBD spoke with a local public health nurse for a lesson on how to use the state’s website to drill down on what’s going on in Ketchikan.
Most of the familiar pandemic statistics — new cases, hospitalizations and deaths — are available on the state Department of Health and Social Services’ Alaska COVID-19 website, says Ketchikan-based state public health nurse Jen Bergen.
“It’s already being shared there, and it has been for quite some time,” Bergen said in a virtual interview last week.
There are a few ways to get there — but maybe the quickest is by typing data.coronavirus.alaska.gov into your browser’s address bar. That presents a few options: pages for information on vaccinations, regional hospital capacity, and cases. Another option is covid19.alaska.gov.
“Most of this information that’s being posted here is going to be under this ‘cases’ dashboard,” she said.
On that case dashboard are several tabs — a statewide summary, pandemic alert levels by borough, demographic info, and one labeled “cases, deaths and hospitalizations.”
“Most of the information that’s on that local dashboard is under the ‘cases, deaths and hospitalizations’ tab,” Bergen said.
That gets you to a page that shows the total number of — guess what — cases, deaths and hospitalizations across the state. With a few clicks on the left-hand side, that can be narrowed to a particular part of the state — say, the Ketchikan Gateway Borough or the Prince of Wales-Hyder Census area. It can also be narrowed by date, so you can look at, for instance, how many cases have been reported in the past week, two weeks, 30 days, and so on. You can also select whether to include residents, nonresidents or both.
“The other thing is cases by onset date versus report date. So the dashboard locally is (based on the) report date, and that means the date that they were actually told to us,” Bergen said.
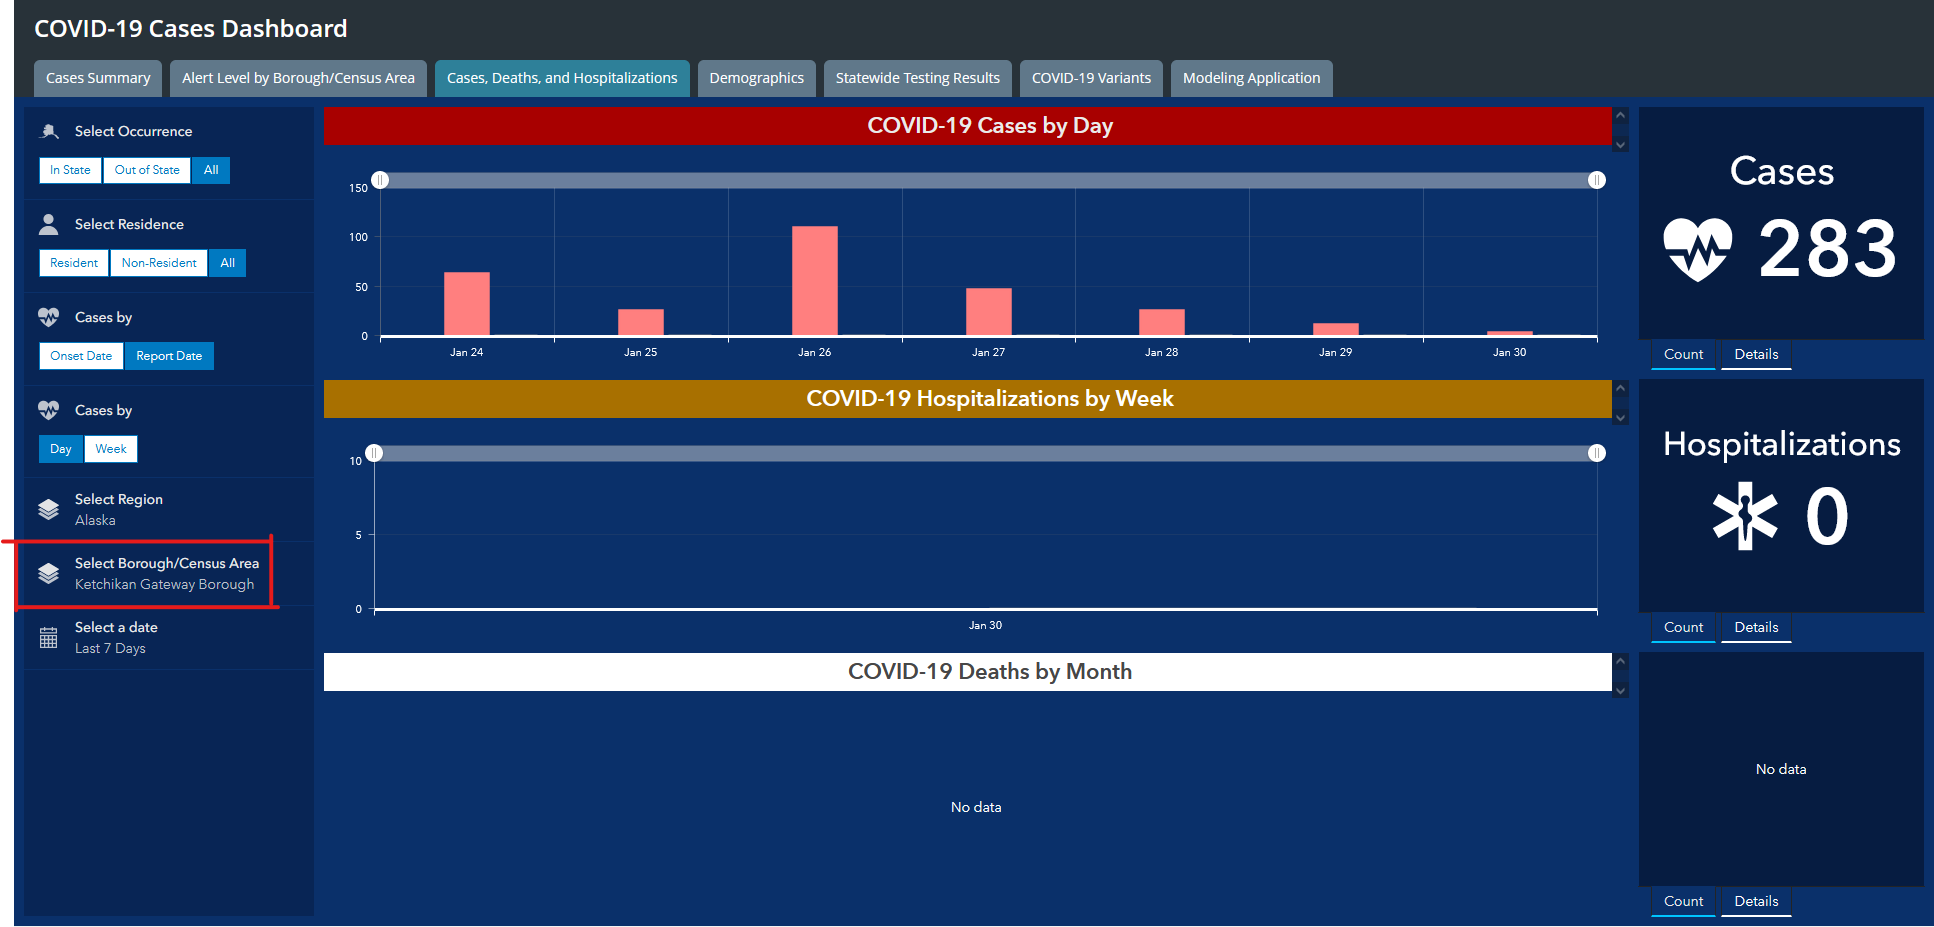
The “cases, deaths and hospitalizations” tab can be customized to show data for Ketchikan, the Prince of Wales-Hyder Census Area, or any other borough or census area. (Screenshot by KRBD)
That’ll adjust a chart in the center of the page. Mousing over each day’s bar brings up the number of cases reported on that particular day.
So: for a quick-and-dirty substitute for the local COVID-19 dashboard, go to the cases dashboard, select “report date” the Ketchikan Gateway Borough, click “all” under residence, and then narrow it to whatever timeframe you’re looking for.
Or, you can go to the “alert levels by borough/census area” tab and click on Ketchikan, which brings up a quick summary.
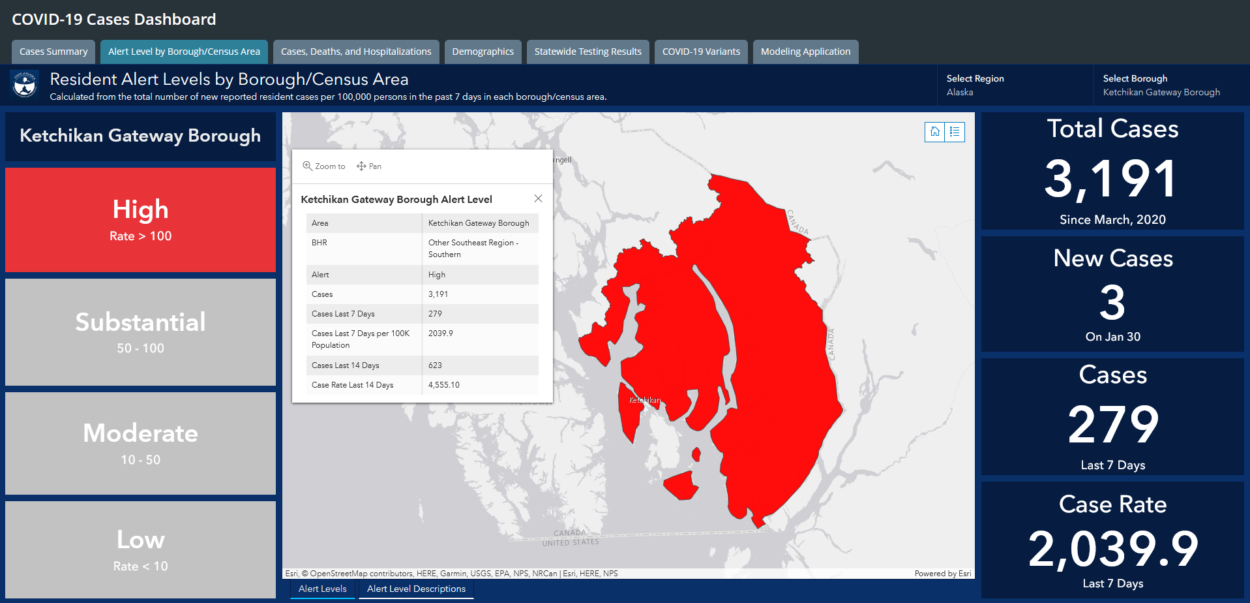
A quick summary of Ketchikan’s COVID-19 situation is available on the “alert level by borough/census area” tab — just click on the Ketchikan area. (Screenshot by KRBD)
There are also charts for hospitalizations and deaths. Hospitalizations are shown cumulatively by week — as of Monday, a total of 40 Ketchikan residents have been sick enough to require hospital care. Deaths are broken out by month.
Bergen says the hospitalization figure is not meant to indicate local hospitals’ patient load — for that, there’s a page on PeaceHealth Ketchikan Medical Center’s website.
“So that is going to continue, and that is definitely where you get the most up to date information is that PeaceHealth Medical Center (site),” she said.
Now, there are some limitations: First, the state cases dashboard does not work especially well on mobile devices. The page crashed repeatedly on two iPhones tested for this story.
It’s also missing some key pieces of information about the number of people actively infected with COVID-19 and where they’re believed to have caught it. But Bergen says those metrics aren’t as useful as they once were.
“So (it was) really, really important in the beginning of the pandemic, to track the active cases,” she said. “As we see community spread, it’s harder to know when people recover.”
As for how people caught the virus, as the state reduces contact tracing, there simply won’t be as much data to report. But Bergen says nurses are still keeping track of who gets sick and where.
“We still in the background will notice if there’s some kind of cluster — meaning for some reason, there is an outbreak locally at say, a food processor or a school or a congregate setting. Public health will still be aware of that. It just won’t be posted on the dashboard,” she said.
And the state and local dashboard numbers don’t totally match up — when KRBD spoke with Bergen late last week, local numbers for the past week were about 4% higher than the state’s numbers.
“That difference does exist because there is a little bit of a lag between cases reported locally versus cases reported to the state,” Bergen said.
But still, Bergen says the state dashboard gives a good overview of pandemic trends — whether cases are high or low, rising or falling — that can be useful as residents make decisions about what measures to take to protect themselves and their community.


